OS Ministry of Transport Road Map
| Ministry of Transport Road Map | |||
 | |||
| |||
| Publisher: | Ordnance Survey | ||
| Scale: | 1:126,720 | ||
| First Published: | 1923 | ||
| Final Publication: | 1936 | ||
| SABRE Maps layer: | Yes | ||
The Ministry of Transport Road Map (colloqually known as MoT Maps) series were the official maps to show classified roads, following their publication by the Ministry of Transport on 1st April, 1923. As such, they are possibly the most important resource documenting the early days of road numbering in Great Britain.
The equivalent mapping in Northern Ireland was the Road Map of Northern Ireland
History


The maps were taken from the OS Half Inch sheets available at the time and indeed, carried the same sheet numbers. As with the base material, they were reduced from the One Inch Third Edition series, but with a specific overlay - in this case 'A' roads in red, and 'B' roads in green, though maps from the mid-1930s displayed 'B' roads in purple.
They were perhaps unique in that they displayed as many classified roads as were practical, including short links in towns that subsequent maps would often miss as unnecessary (which, to be fair, to the typical motorist they generally were). In many places, the base mapping used was very old for the time, in some cases dating from the Victorian era. This lead to a strange situation where newly constructed roads did not appear on the base map, and only the overlay was present. This continued throughout the life of the maps, with later editions appearing to have their overlays less and less accurate, when in actual fact the overlays were relatively accurate and showed, for example, new bypasses, when the underlaying map did not.
In common with the Half Inch map series the MoT maps were based upon, different series was issued for England and Wales, and for Scotland as the base mapping used different projections - Cassini (Delamere) in the case of England and Wales, whilst the Scotland sheets used the Bonne (Scotland) projection.
Additionally, a set of six maps at the two-inch scale were created for the London area (extending as far as Berkhamsted, Brentwood, Guildford and Sevenoaks) meaning that coverage of the area is available in high clarity and shows that no road numbering was completed within the City of London, with all numbering terminating at the boundary of the City.
Despite it being allocated a sheet number (England and Wales sheet 4) and being shown on sheet index maps, the Isle of Man was never issued as an MoT Map. However, there was a Sheet 4 packaged with MoT map sets, although this was actually a standard One Inch Popular Edition map, specifically Sheet 17.
While the London maps and a large number of Scotland maps were never officially reissued, the England and Wales maps were reissued annually following the reviewing of road classification and budgets on 1st April (England and Wales) or 16th May (Scotland), up to the 1930-31 editions, although most maps were not revised every year. Indeed, the map with the most revisions, Sheet 12 (Liverpool, Manchester and Chester) only has five different editions in the life of the entire MoT map series.
With the exception of a single map issued for the 1931-32 edition (England Sheet 1), the maps were then withdrawn due in part to poor sales.
The MoT Maps saw a final hurrah in 1936-37 when fourteen of the England and Wales sheets and one Scottish sheet were released following the 1935 Road numbering revision, though by that time the official map to show road numbering was the Ten-Mile Road Map of Great Britain. By 1936, road numbers were appearing on Quarter Inch maps, on the One Inch Fifth Edition maps across southern England, and across a number of Special District maps at the half-inch scale; and they'd even started appearing on the OS Three Inch mapping of London.
However, it was not until post-World War 2 that regular One Inch coverage of road numbers for the whole of Great Britain was provided on the New Popular Edition and Scottish Popular Edition maps of the time.

Variants
MoT maps were produced in various different styles. In common with mapping from the time, they were produced in folded sheets printed on cloth or paper, whilst there were also "dissected" editions, where the folds were separated to a fabric backing, meaning that the folds were stronger than those on ordinary sheets. The standard dissected editions contained 18 separate panels.
In addition, there were Library editions that were dissected, but at a larger plan area containing eight sections; whilst the legal deposit libraries had the options of flat sheets.
Special collections were also available - leather-covered boxed editions containing the full set of original 1922-23 Library editions for England and Wales exist (as well as boxed editions containing sets of later maps), whilst later, smaller collections containing six maps were also available. These special collections, in addition to the maps, also contained an Index and Reference Book to accompany the maps.
Covers
The covers were black-on-orange and showed a drawing of a typical roadside scene (here where the then A31 - now the A3090 met the B3043 near Hursley in Hampshire). Inside the inner flap were descriptions of various traffic signs, as well as an incorrect description of the zoning system which includes the usual error of the A2 being described as a zone boundary instead of the River Thames.
The Library Editions were in a plain buff cover with the sheet number printed on the outside, but with no other identifying marks beyond the sheet number.
SABRE Maps coverage
SABRE Maps has full coverage of the 1923 sheets, including the special London maps. There are also a number of other maps available dated between 1924 and 1936.
Sheets
Main Article: MoT Map sheet listing
Sheetline co-ordinates
As the MoT maps pre-date any form of National Grid, each sheet does not have co-ordinates printed on them, but simply an alphanumeric grid with letters on the vertical axis and numbers across the top.
Knowing the locations of the corners of each sheet, whilst interesting in its own right, is essential to georeference each map and allow them to appear on SABRE Maps.
The below tables have therefore been produced so that the relevant values for the map series can simply be referenced for these purposes rather than having to calculate via the SABRE Maps Co-ordinate Finder.
In these tables, the values of each corner location are in miles from the relevant origin point, with positive numbers being north and east of that point, and negative numbers being south and west of the origin.
The England and Wales sheets used the Cassini (Delamere) projection; whilst the Scottish sheets used the Bonne (Scotland) projection.
England and Wales
|
Scotland
|
- MoT Sheet Index
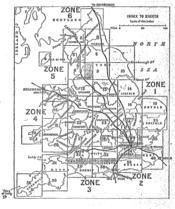
England & Wales
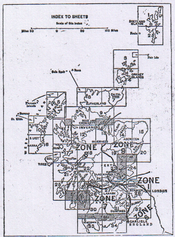
Scotland


-old.png)
.png)